Emily White, Research Associate, Bard College/Hudsonia

When evaluating a site for the potential installation of micro hydropower system, it is important to consider the existing water quality at the proposed site in order to determine how installation might impact water quality. For the Saw Kill project, a multiparameter water quality monitoring sonde has been installed in the Annandale Dam impoundment.
Monitoring Equipment
Monitoring Equipment

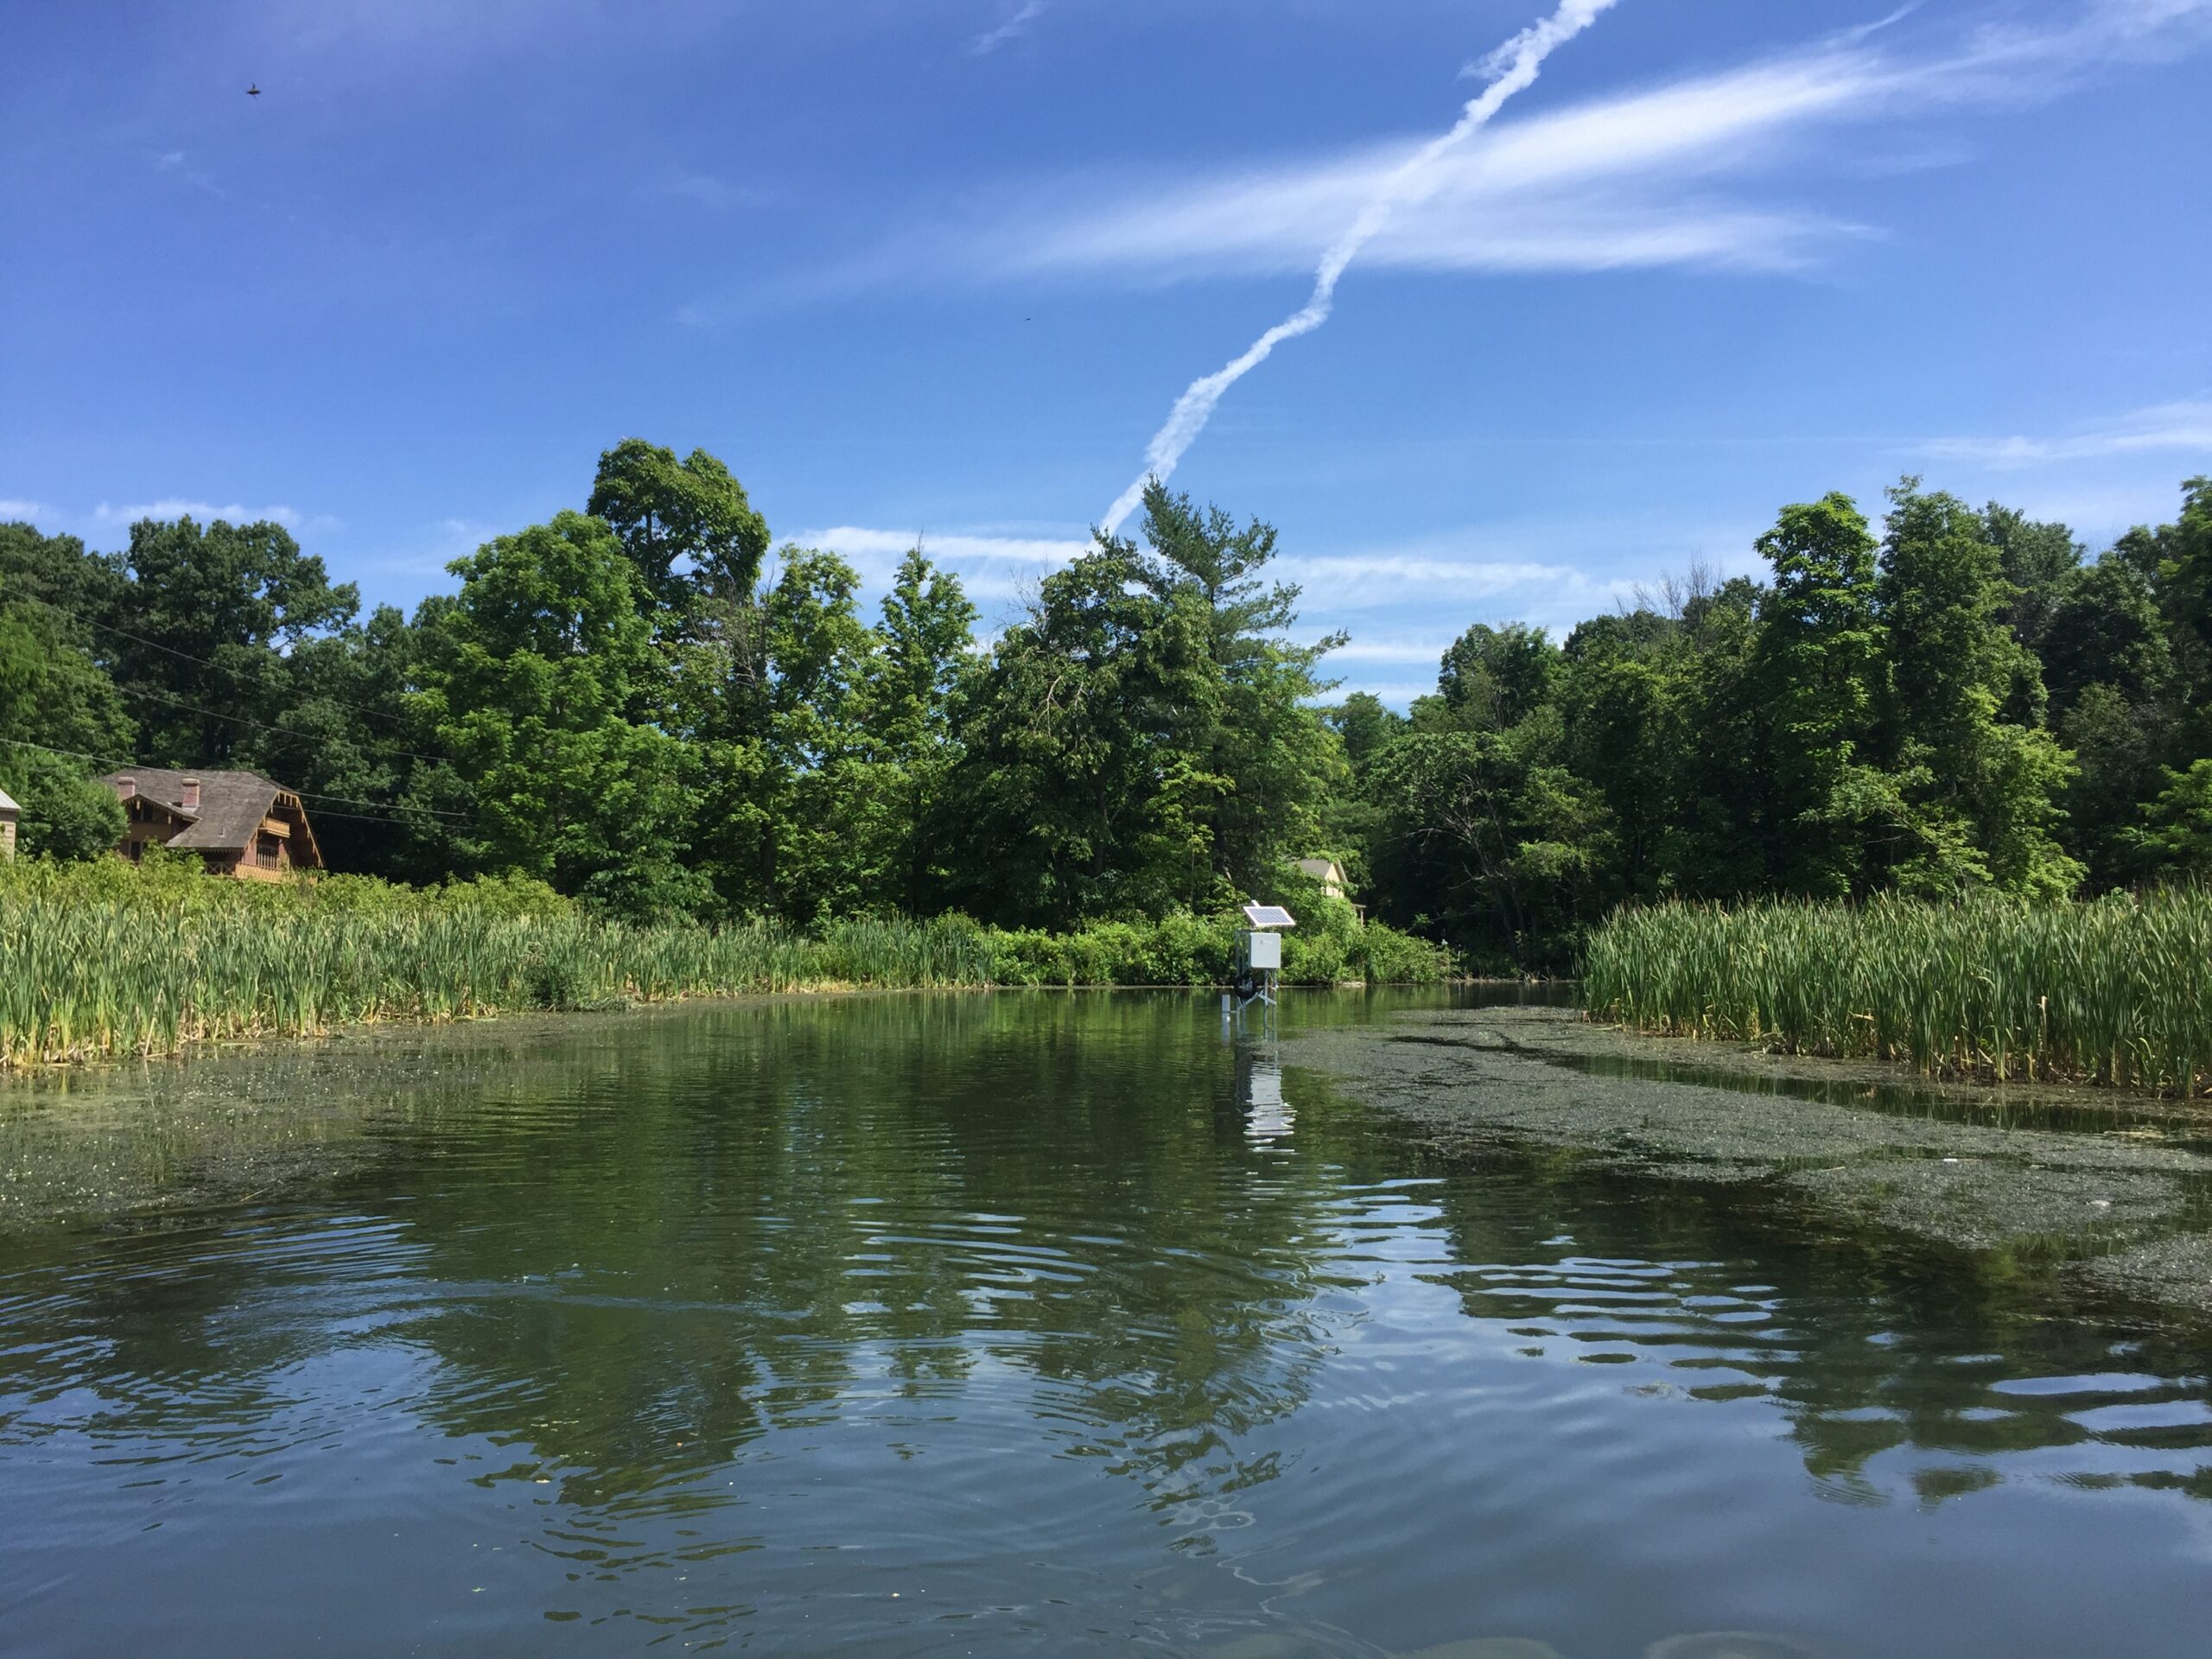
The water quality monitoring system consists of a YSI EXO2 multiparameter sonde, housed in a protective PVC pipe that is fastened to one leg of the support structure. The sonde is connected by cable to a YSI Storm 3 Data Logger, contained in an all-weather enclosure. In addition to the data logger, this box holds a cellular modem and antenna for transmitting collected data, a desiccant canister to keep the cable dry, and a 12 Volt battery to power the system. The battery is recharged by the solar panel mounted on top of the support structure. The system is programmed to “wake up” and collect data every 15 minutes.
Monitoring System


Measured Parameters
Measured Parameters
The sonde is customized with sensors that measure a number of water quality parameters, including: temperature, conductivity, pH, turbidity, dissolved oxygen, and total algae. The instrument also has a barometric pressure sensor that is used to determine water depth. The sonde is designed for long-term deployment and is equipped with a wiper to keep the sensors clean. To ensure data accuracy, the instrument must be routinely serviced (i.e., cleaned and calibration).


Water temperature
Water temperature is important because it controls the rates of the chemical and biological processes that occur in natural waters. Temperature affects the solubility of chemicals. For example, the oxygen content of water increases as temperature decreases. The survival of aquatic organisms (e.g., microbes, macroinvertebrates, and fish) also depends on water temperature with different optimal temperatures for different species. Temperature can be measured with a thermometer but the sonde uses a thermistor. The thermistor’s resistance changes with temperature and an algorithm is used to convert the measured resistance to temperature. Temperature is measured by the sonde with an accuracy of ±0.02°C.
Natural waters contain dissolved inorganic solids that carry positive and negative charges. These dissolved ions, which come from rocks and minerals as well as anthropogenic inputs, conduct electricity. Conductivity is a measure of the ability of an electrical current to flow between two metal plates (electrodes) that are immersed in water. Voltage is applied between the electrodes and the measured voltage drop caused by the resistance of the water is converted to a conductivity, in units of micro- or millisiemens per centimeter (µS/cm or mS/cm), by a conductivity meter. A water that contains more dissolved ions will have a higher conductivity. Non-ionic compounds (e.g., oil) do not conduct electricity and therefore will not contribute to conductivity.
The solubility of ionic compounds is influenced by temperature, which affects the measured conductivity. At higher temperatures, water contains a higher concentration of dissolved ions, resulting in higher conductivity. In order to eliminate the effect of temperature on measured conductivity (so that observed differences can be attributed to the concentration of ions present) conductivity is reported as conductivity at 25°C or specific conductance. This temperature compensation is done automatically by the sonde, using the measured temperature. This allows data collected at different temperatures to be directly compared. The sonde’s accuracy for specific conductance is ±1% of the reading.
The pH of a natural water describes the acidic or basic characteristics of the water. pH is reported on a scale of 1 to 14, with lower values indicating more acidic water. A pH of 7 is considered neutral. As with temperature, pH affects many of the biological and chemical processes that occur in natural waters. When pH falls outside of the range of 6.5-8, aquatic organisms are physiologically stressed. At low pH (i.e., acidic conditions), the mobility of some contaminants can also be enhanced, resulting in increased uptake by aquatic organisms. A pH meter works by measuring the electric potential across an electrode when immersed in water. The sonde is capable of measuring pH with an accuracy of ±0.1 pH units. When data quality is less important (i.e., lower accuracy is acceptable), pH can be measured more cheaply by using color comparators.
Turbidity is the measurement of light scattering by suspended particles in a natural water. It serves as an indirect measure of the concentration of suspended solids (e.g., clay, silt, sand, algae, and organic matter), which influences water clarity. Turbidity is therefore a useful tool for monitoring changes due to stormwater and other sources of runoff. Turbidity is measured using a turbidimeter, an instrument that shines light on a water sample and measures the intensity of light scattered by particles in the sample (in nephelometric turbidity units or NTU). The sonde uses a submersible turbidimeter, an optical sensor that uses an infrared light source, which measures turbidity in formazin nephelometric units (FNU). Both are valid ways of measuring turbidity but it is important to realize that turbidity data collected with a meter and a sensor are different. Turbidity is measured by the sonde with an accuracy of ±0.3 FNU. A cheaper alternative to turbidity measurements is the use of a Secchi disc or transparency tube to determine water clarity.
Dissolved oxygen (DO) is essential to aquatic organisms including fish, invertebrates, bacteria and plants. Natural waters receive oxygen from the atmosphere (by diffusion and aeration) and through photosynthesis by phytoplankton, algae, and other plants. Oxygen is consumed by respiration, the decomposition of organic material by microbes, and some chemical reactions (e.g., involving chemical pollutants). DO is measured in either milligrams per liter (mg/L) or percent saturation, which is the amount of oxygen in a liter of water relative to the total amount of oxygen that the water can hold when it is in equilibrium with the atmosphere. Dissolved oxygen is dependent on temperature and barometric pressure. The solubility of oxygen decreases as temperature increases and as altitude increases. In addition, solubility is lower in higher salinity water (e.g., seawater) compared to freshwater. There are several ways that DO can be measured. The sonde uses an optical dissolved oxygen sensor to measure the interaction between oxygen and a luminescent dye. Dissolved oxygen is measured by the sonde with an accuracy of ±1% of the reading.
The sonde is equipped with a total algae sensor that provides semi-quantitative information about the algal population present in water by measuring the amount of photosynthetic pigment present. The sensor is an optical, dual-channel sensor that uses fluorescence to determine chlorophyll (from phytoplankton) and phycocyanin (from blue-green algae) concentrations in relative fluorescence units (RFU).
Continuous Monitoring Data
Continuous Monitoring Data
Multiparameter instruments containing sensors (for the measurement of specific physical, chemical, or biological properties) that are bundled in a single housing (a sonde) offer a number of advantages for monitoring environmental waters. Compared to the alternatives of making readings in the field, collecting discrete samples, and conducting multiple analyses; the time required is significantly reduced. In addition, In situ measurements are likely to be more accurate and precise. Data can be collected with high frequency over long time periods, making it possible to observe trends on environmentally relevant time scales (e.g., daily and seasonal changes). Instrument software allows for quick data visualization but for most applications, data processing is required.
Please contact Emily White to request data or further information.
Acknowledgements – Thanks to Robin Moore and Spike Pagano (Bard Buildings and Grounds) for assistance with installation. Funding was provided by a New York State Energy Research and Development Authority (NYSERDA) Energy to Lead Competition grant, managed by Laurie Husted (Chief Sustainability Officer, Bard College).

No responses yet