This web map application demonstrates how to access publicly available web mapping services for ranges and distributions of key plant and animal species that have been modeled by the National USGS Gap Analysis Program.
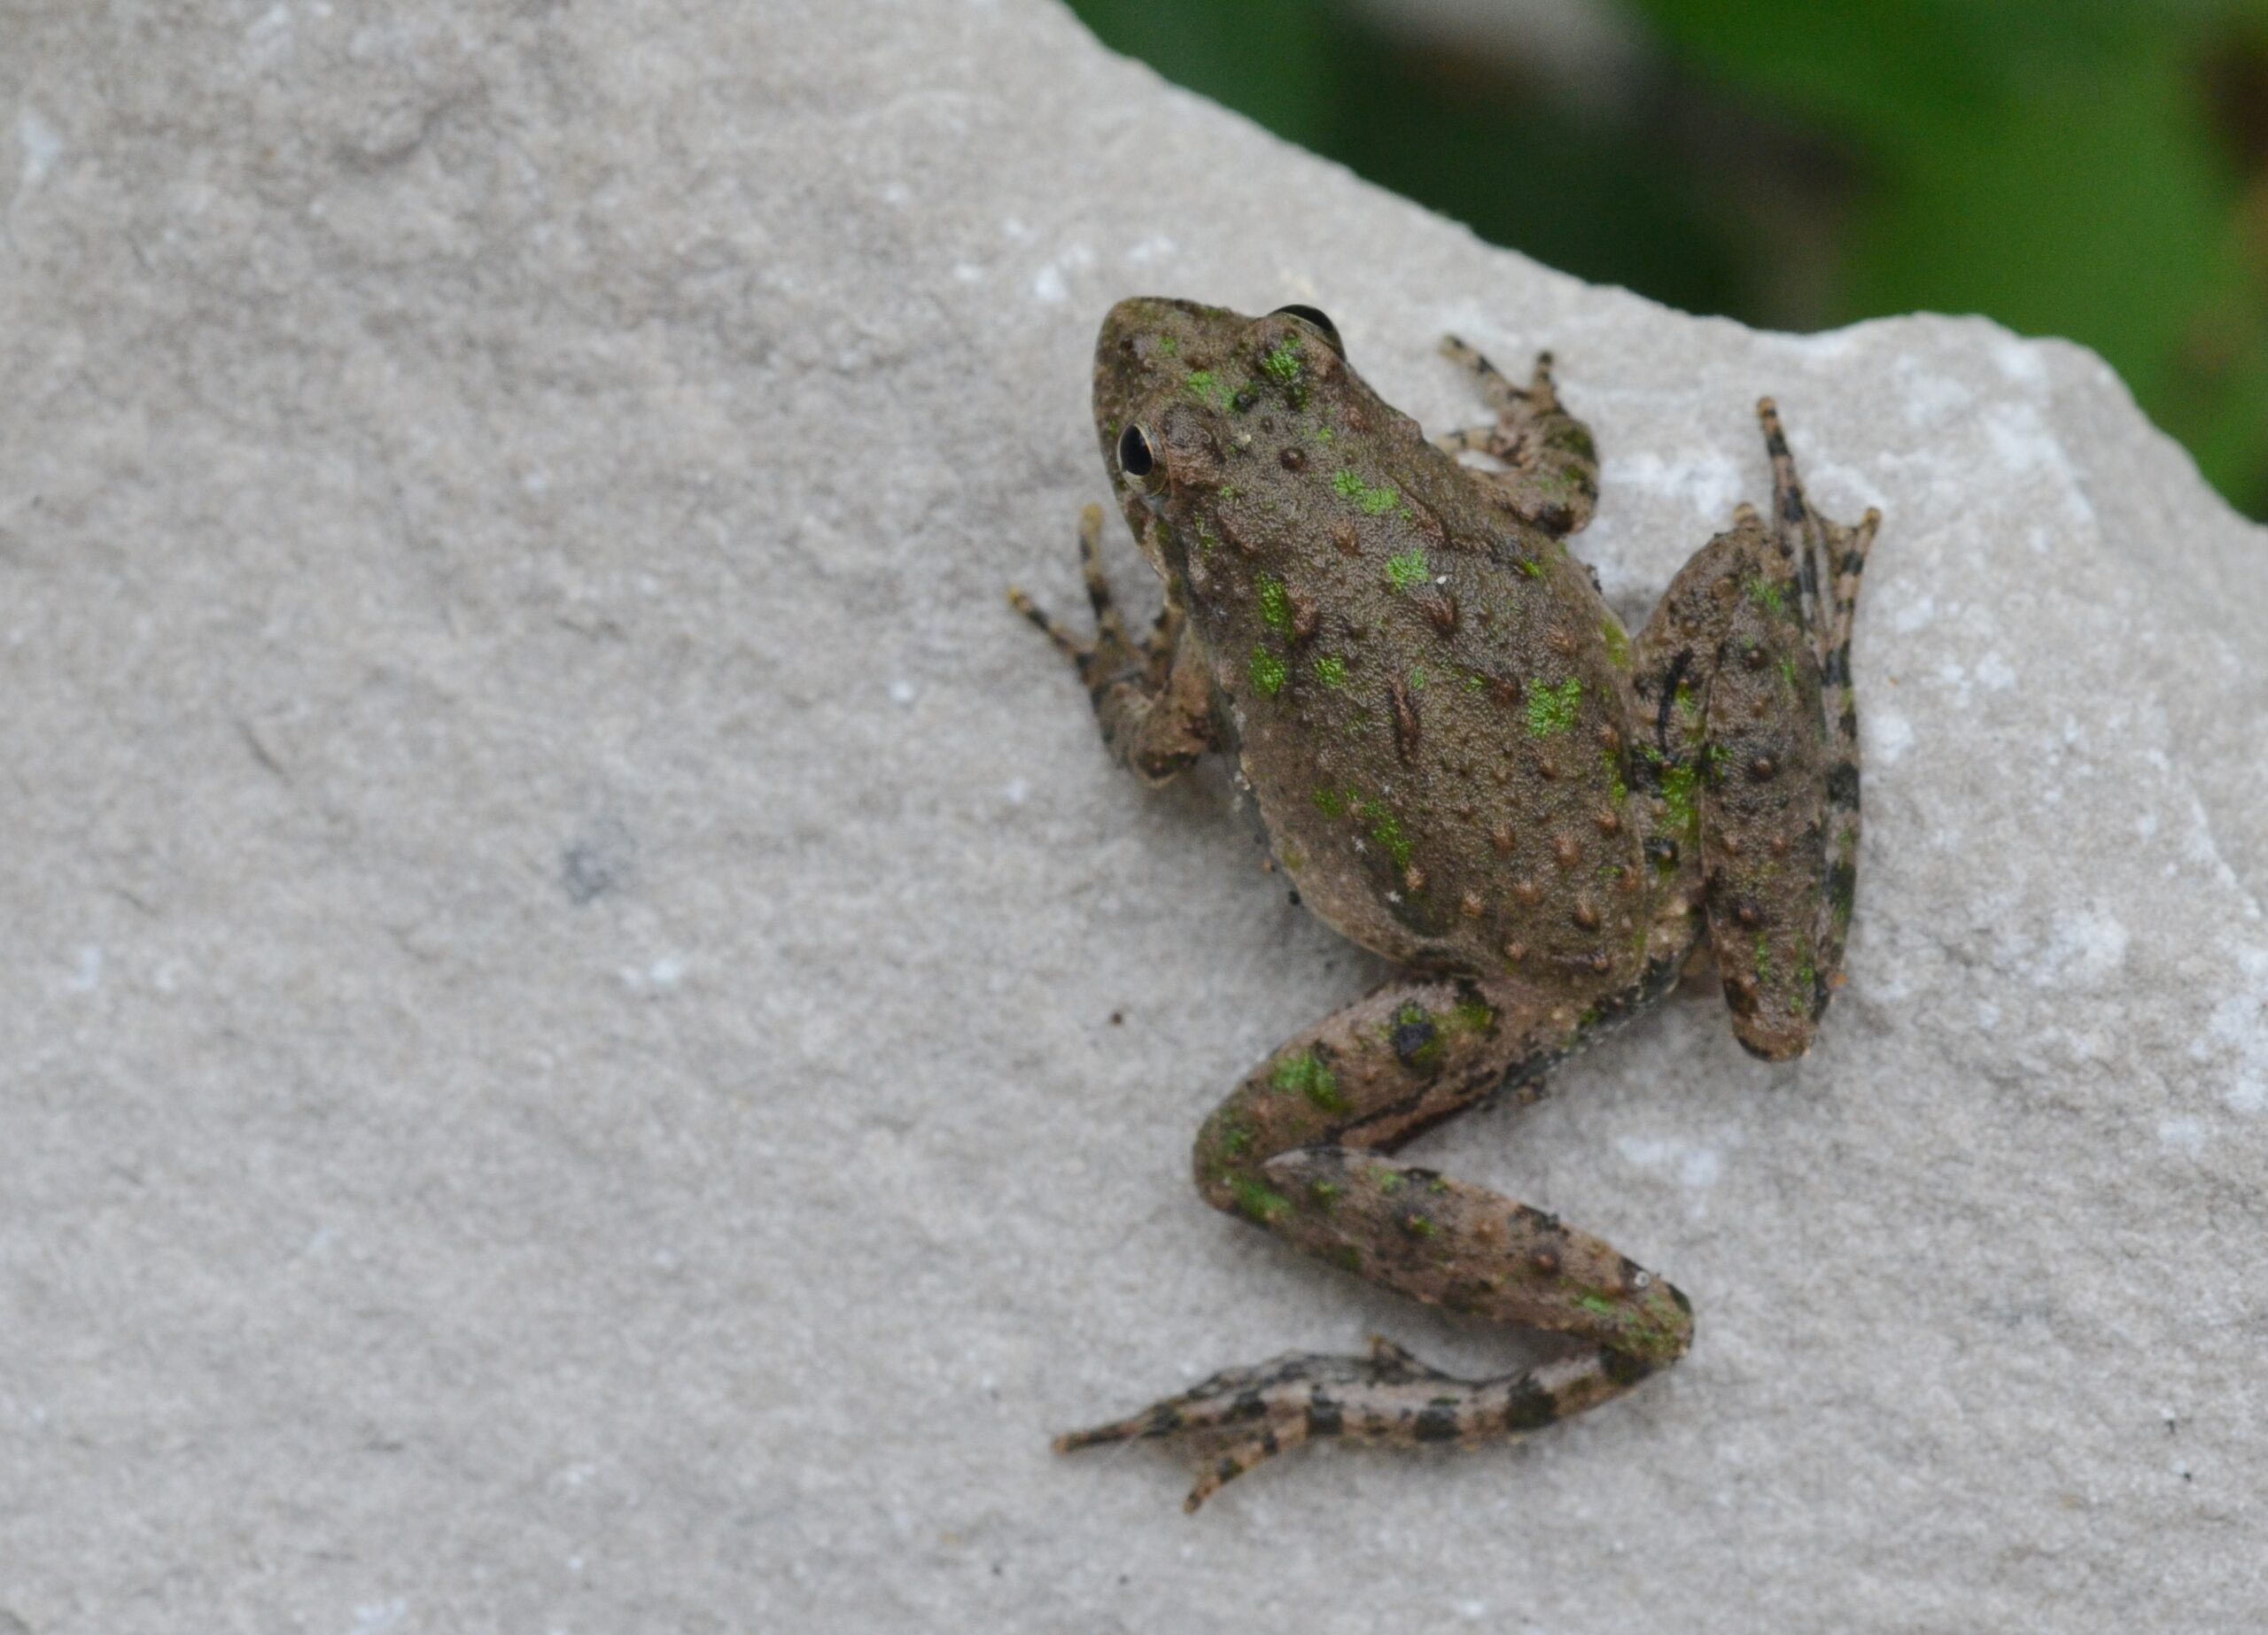
This information can be useful to indicate the potential for key threatened or endangered species to exist in your project area. Three examples of species listed as endangered in New York State were chosen to include in this iteration of the map below (New York State Department of Environmental Conservation, 2017):
Please note that the data are based on models created by scientists at the United States Geological Survey, and are not based on local field observations. As with all such data, some vagueness in the absolute accuracy or classification may exist (e.g., winter vs summer vs year-round habitats), but nonetheless the data are a good indicator of the POTENTIAL for certain endangered species to exist in any particular area.
Unfortunately, no web-service data for aquatic species is currently available for New York through the Gap Analysis Program, but the depth and breadth of information available for terrestrial and avian species is impressive and well documented. An Aquatic GAP Analysis program is underway and slowly increasing the areas of coverage for various aquatic organisms and risks. To keep abreast of progress with the Aquatic mapping program visit:
To use the map:
The map legend can be toggled on and off with the button in the upper right-hand corner.
The layers displayed at any given time can be modified using the button on either side of the map window.
This map is intended as a demonstration of how to combine publicly available species distribution maps with publicly available information like dam locations using web services. If you find more layers or data in the USGS GAP analysis program (or other websites) that you think should be added to the maps on this site, please contact us and we will get them included!


No responses yet